Debugging
On this page, you will find information on how to debug problems using Pathom 3.
REPL debug
First, we will see how to inspect the stats of a Pathom process using the REPL.
Pathom Run Stats
When Pathom runs, it also generates some data about what happened on top of developing your response. This data includes the plan generated for your request and details about what happened to run each node in this graph.
You can find this data living the meta data of the returned map. This works for the
EQL interface and if you use the runner directly. To see this data with
Smart Maps you should use the psm/get-with-stats helper.
Let's have a look at what is inside this data, and this is our source example:
(pco/defresolver area [{:keys [width height]}]
  {:area (* width height)})

(pco/defresolver width [{:keys [x x2]}]
  {:width (- x2 x)})

(def env
  (pci/register
    [area width]))

(p.eql/process
  env
  {:x 10 :x2 30 :height 40}
  [:area])
The result map is {:area 800}. Now let's look at what is in meta:
{::pcr/run-stats
 {::pcr/compute-plan-run-start-ms
  3.701837395085457E9

  ::pcr/compute-plan-run-finish-ms
  3.701837397421086E9

  ::pcr/graph-run-start-ms
  3.701837395080634E9

  ::pcr/graph-run-finish-ms
  3.701837399062158E9

  ::pcr/node-run-stats
  {2
   {::pcr/resolver-run-start-ms  3.701837397955496E9
    ::pcr/resolver-run-finish-ms 3.701837397997367E9
    ::pcr/node-run-input         {:x 10, :x2 30}
    ::pcr/node-run-output        {:width 20}}
   1
   {::pcr/resolver-run-start-ms  3.701837398639112E9
    ::pcr/resolver-run-finish-ms 3.701837398674007E9
    ::pcr/node-run-input         {:width 20, :height 40}
    ::pcr/node-run-output        {:area 800}}}

  ::pcp/index-ast
  {:area {:type :prop, :dispatch-key :area, :key :area}}

  ::pcp/index-attrs
  {:width #{2}, :area #{1}}

  ::pcp/index-resolver->nodes
  {com.wsscode.pathom3.demos.troubleshoot/area  #{1}
   com.wsscode.pathom3.demos.troubleshoot/width #{2}}

  ::pcp/root
  2

  ::pcp/nodes
  {1
   {::pco/op-name          com.wsscode.pathom3.demos.troubleshoot/area
    ::pcp/node-id          1
    ::pcp/expects          {:area {}}
    ::pcp/input            {:width {}, :height {}}
    ::pcp/node-parents     #{2}
    ::pcp/source-for-attrs #{:area}}
   2
   {::pco/op-name          com.wsscode.pathom3.demos.troubleshoot/width
    ::pcp/node-id          2
    ::pcp/expects          {:width {}}
    ::pcp/input            {:x {}, :x2 {}}
    ::pcp/source-for-attrs #{:width}
    ::pcp/run-next         1}}}}
Take some time to read the available data from stats. If the name of some attribute doesn't make sense to you, navigate to the spec definition of that property to find a text description of it.
Note we have a mix of ::pcp (planner) and ::pcr (runner) keys in this map root. The
namespace is an indication of what part of the system owns that key.
On top of the plan data, the runner data includes runtime information about the execution. This data contains timestamps for many events and specialized data depending on the kind of node.
Looking for issues
Since Pathom 3 moved to strict mode, all these errors will surface by default. While using lenient mode you can see the stats as described in this section.
Let's write a broken query to debug it:
(-> (p.eql/process
      ; use lenient mode to get error on stats
      (assoc env ::p.error/lenient-mode? true)
      {:x 10 :height 40}
      [:area])

    (meta)
    ::pcr/run-stats)
=>
{::pcp/index-ast                  {:area {:dispatch-key :area,
                                          :key          :area,
                                          :type         :prop}},
 ::pcp/nodes                      {},
 ::pcp/unreachable-paths          {:area {}, :width {}, :x2 {}},
 ::pcp/unreachable-resolvers      #{com.wsscode.pathom3.docs.demos.core.debugging/width
                                    com.wsscode.pathom3.docs.demos.core.debugging/area},
 ::pcr/compute-plan-run-finish-ms 1.017579107877868E9,
 ::pcr/compute-plan-run-start-ms  1.017579107436291E9,
 ::pcr/graph-run-finish-ms        1.017579107898803E9,
 ::pcr/graph-run-start-ms         1.017579107430066E9,
 ::pcr/node-run-stats             {}}
Most notably, check ::pcp/unreachable-paths and ::pcp/unreachable-resolvers. Looking
at then we can see what Pathom tried but failed to accomplish. This a good time to look
for typos or check if there is missing information on your data.
Smart Stats
During process time, Pathom collects the minimum data as it can to reduce the overhead. So, for example, it won't calculate durations during this process. Simultaneously, if the data were available as simple props, that would also be great.
To get the best of both worlds, Pathom provides resolvers that do these interesting computations. Using those with a Smart Map gives easy access to these attributes while adding zero cost at processing time.
An easy helper to start a smart stats is available at the Smart Maps namespace. Here is an example to fetch the total process duration from run stats:
(-> (p.eql/process
      env
      {:x 10 :x2 30 :height 40}
      [:area])

    (meta)
    ::pcr/run-stats
    (psm/smart-run-stats)

    ::pcr/process-run-duration-ms)
; => 0.6624890565872192
You can use datafy to explore the available attributes from the smart stats (as you can with any Smart Map):
(-> (p.eql/process
      env
      {:x 10 :x2 30 :height 40}
      [:area])

    (meta)
    ::pcr/run-stats
    (psm/smart-run-stats)

    clojure.datafy/datafy)
Debug with Pathom Viz
Pathom Viz is a developer app created to assist in the development with Pathom. In Pathom Viz you can:
- Run queries with an auto-complete feature in the tool editor
- Trace the requests to understand the bottlenecks of the process
- Explore the app index with Index Explorer
- Track all requests made to your app, and see trace details of those
Download the app
You can download Pathom Viz at the releases page.
Mac OS Notes
Notice that I don't have an Apple ID so I can't sign the app on the Mac version, to run the app:
- Download the
.dmgfile - Open and drag pathom to the Applications
- Open the Applications folder on Finder
- Attempt to open the app (you will see a message saying the app isn't signed, options to delete or cancel)
- Right-click on it and click open (this is important, don't just double-click on it)
- It may show the
Openbutton on the dialog. If not, repeat the previous step, and it should appear
Connect the app
The next step is to connect your environment with the app.
First you have to include the Pathom Viz Connector dependency to your project:
{:deps {com.wsscode/pathom-viz-connector
        {:mvn/version "2021.04.20"}}}
You can also do it with a local deps aliases:
{:aliases
 {:dev/pathom-tools
  {:extra-deps
    {com.wsscode/pathom-viz-connector
     {:mvn/version "2021.04.20"}}}}}
If you didn't open the Pathom Viz app yet, do it now.
Then, set up your environment to connect with the app:
(ns com.wsscode.pathom-viz.connector.demos.pathom3
  (:require [com.wsscode.pathom.viz.ws-connector.core :as pvc]
            [com.wsscode.pathom.viz.ws-connector.pathom3 :as p.connector]
            [com.wsscode.pathom3.connect.built-in.resolvers :as pbir]
            [com.wsscode.pathom3.connect.indexes :as pci]
            [com.wsscode.pathom3.interface.eql :as p.eql]))

; you can use goog.defines on ClojureScript or env vars in Clojure
; the important part is to have a flag to decide when to connect the parser
(def CONNECT_PARSER? true)

(def registry
  [(pbir/constantly-resolver :pi Math/PI)
   (pbir/single-attr-resolver :pi :tau #(* 2 %))])

(def env
  (cond-> (pci/register registry)
    CONNECT_PARSER?
    ; give your environment a unique parser-id, this will ensure reconnects work as
    ; expected
    (p.connector/connect-env {::pvc/parser-id `env})))

(comment
  (p.eql/process env
    [:tau]))
The attribute name ::pvc/parser-id is an inheritance from Pathom 2, keeping this
name for compatibility.
Once you load this file, you should see a new tab appearing in Pathom Viz:
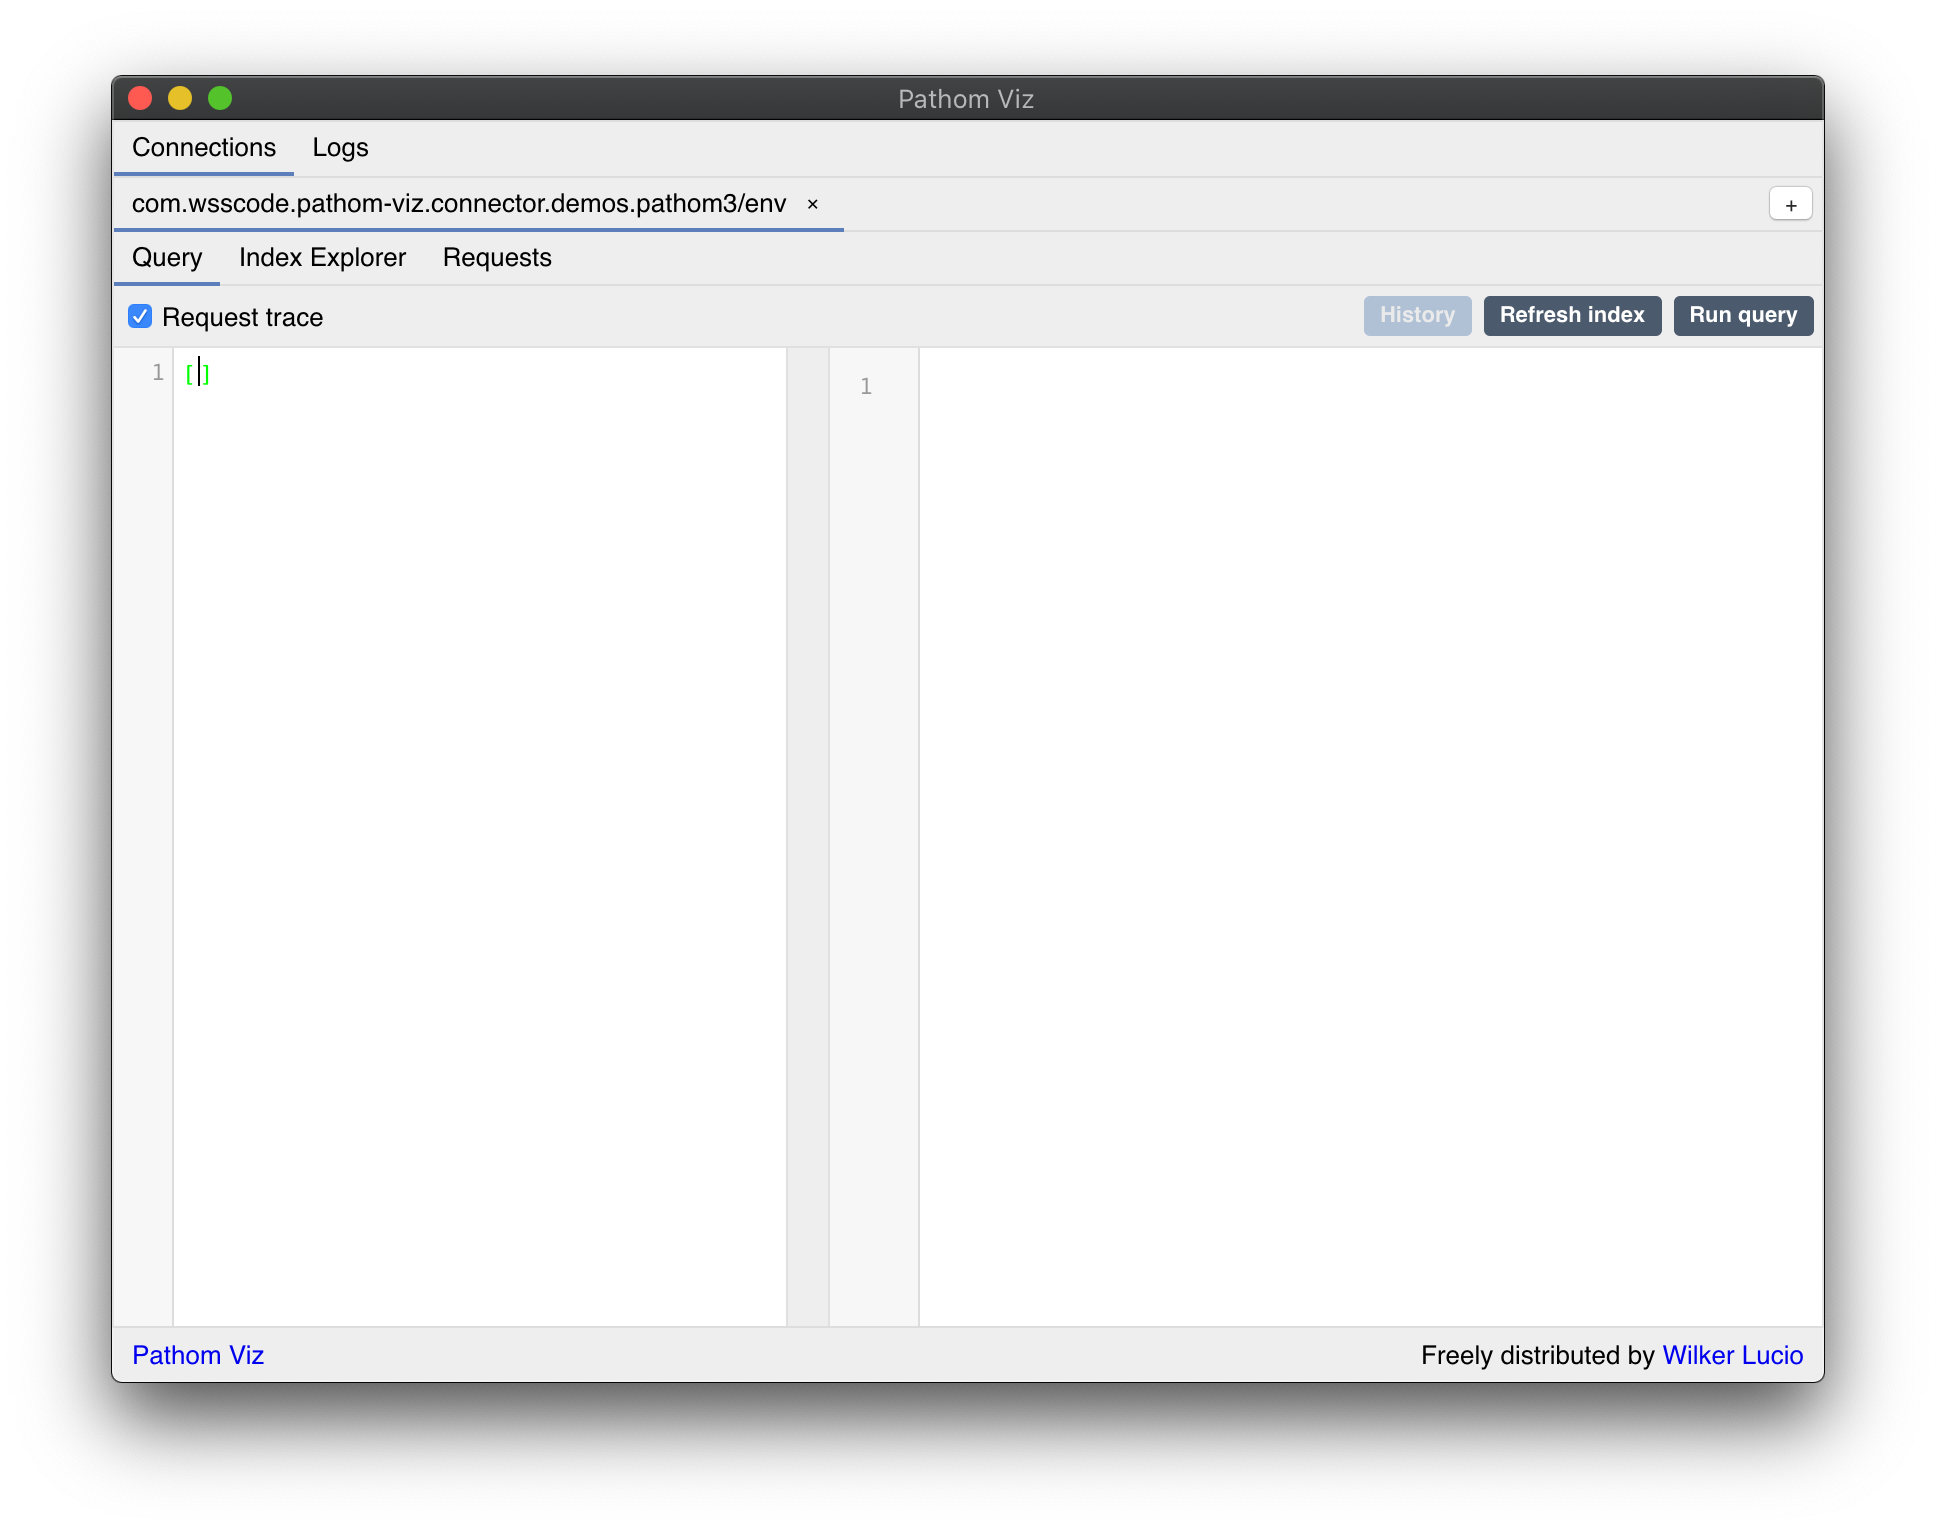
Query Editor
The query editor provides an environment to run queries using your connected environment.
The query editor provides auto-complete for exploration:
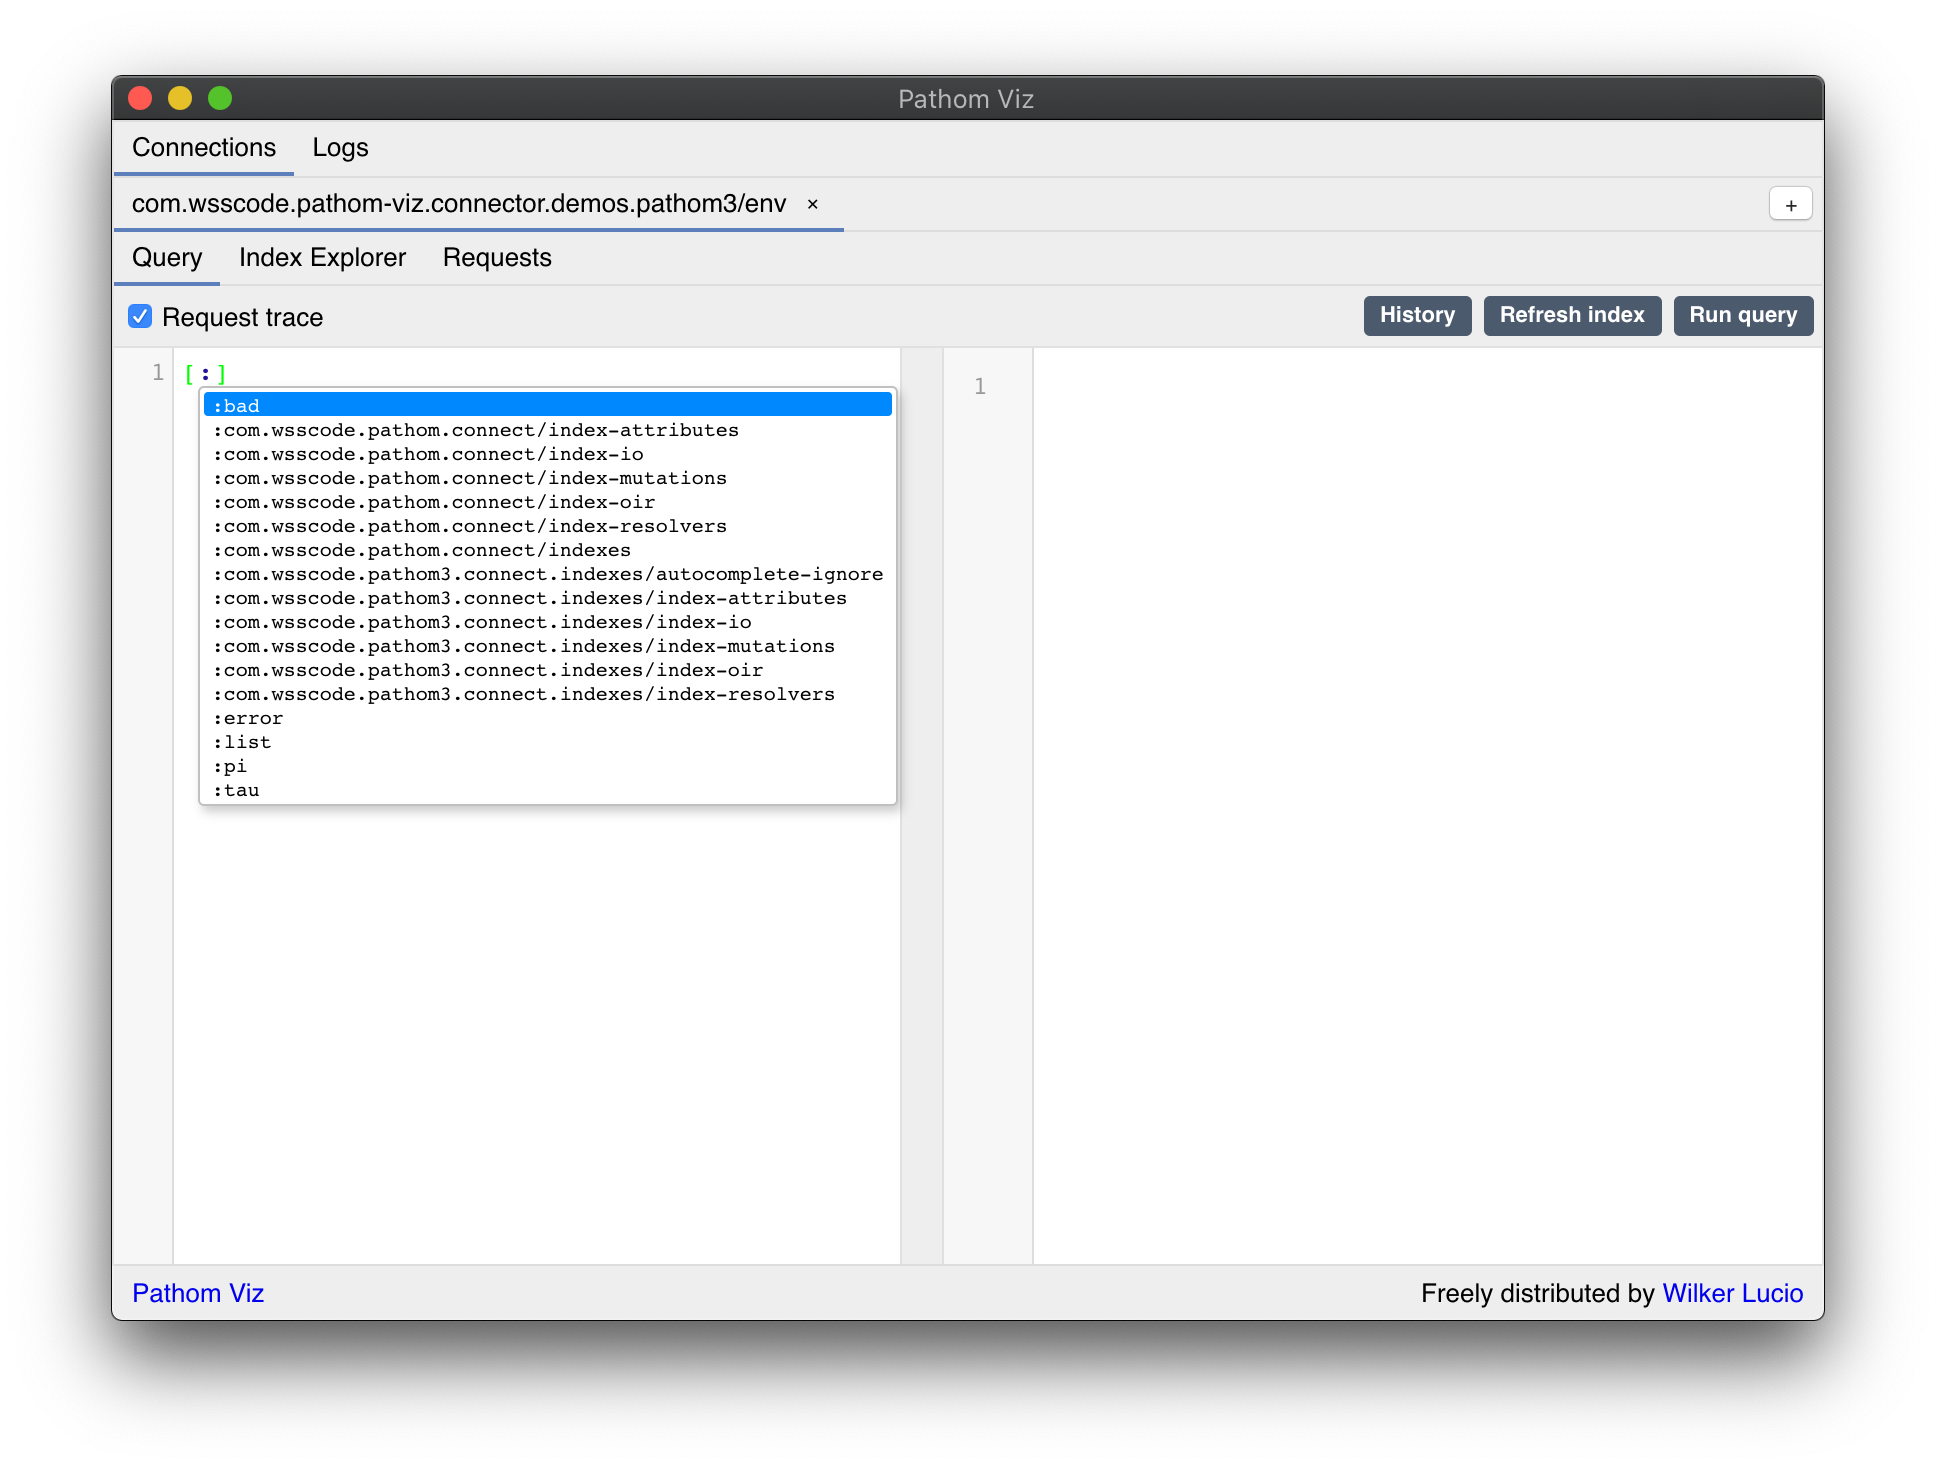
The auto-complete is contextual. This means depending on which part of the query you are, Pathom Viz will offer different attribute suggestions.
When you run a query, the result will appear on the right, and the query is saved to a query history.
Bellow the results there is the trace viewer, described in the next section.
Tracer View
The tracer view displays a timeline of the things that happened during the query process.
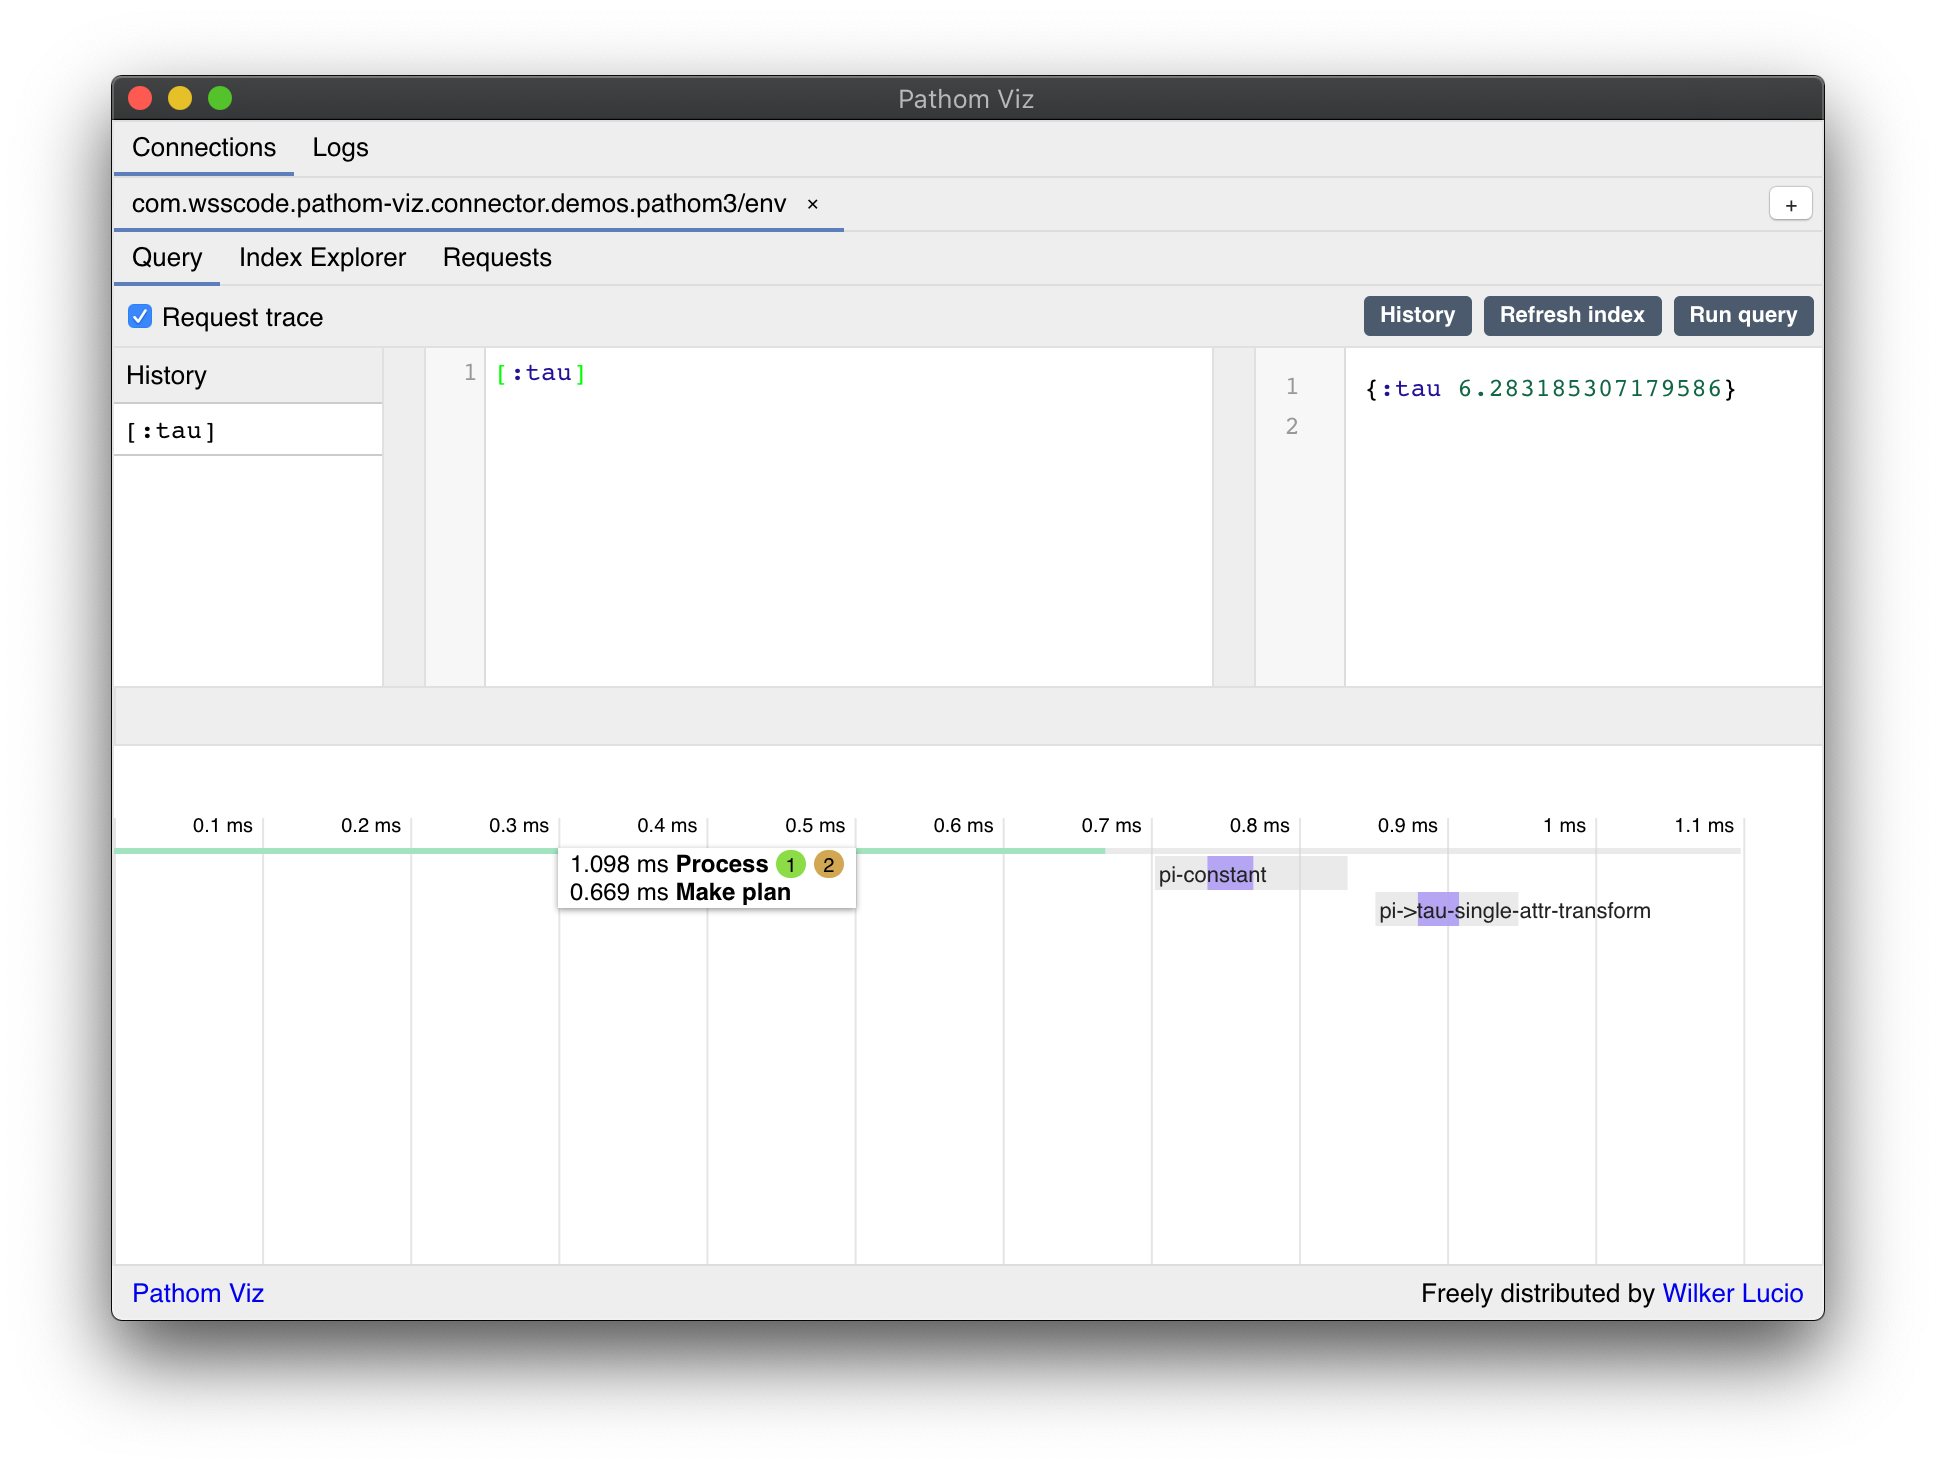
Trace blocks
Each gray block in the timeline can be one of:
- A graph process: the first short bar is one, but also when a process trigger sub-processes, each sub-process has its graph bar
- Node execution: these bars go below the graph process and represent the execution of a node in the graph
Inside the bars, you will see events that cover part of it.
Mouse over the events to see more details and the precise duration of each.
In that hint, you can see the times for each event under the mouse. You will also see one or two badges on the right side.
The green one is the number of events in that block. The yellow one tells how many direct children this block has (this is absent when the number of children are zero).
You will see some different colors filling the blocks. These are their meaning:
- Green: generic events
- Purple: resolver call
- Red: failed operation
- Blue: batch resolver call
Nested traces
When Pathom process a sub-query, that nested details are placed below the block, they
happened. In this case, you will see a + OR - icon on the left side of the block.
Use this to toggle the visibility of the children's blocks.
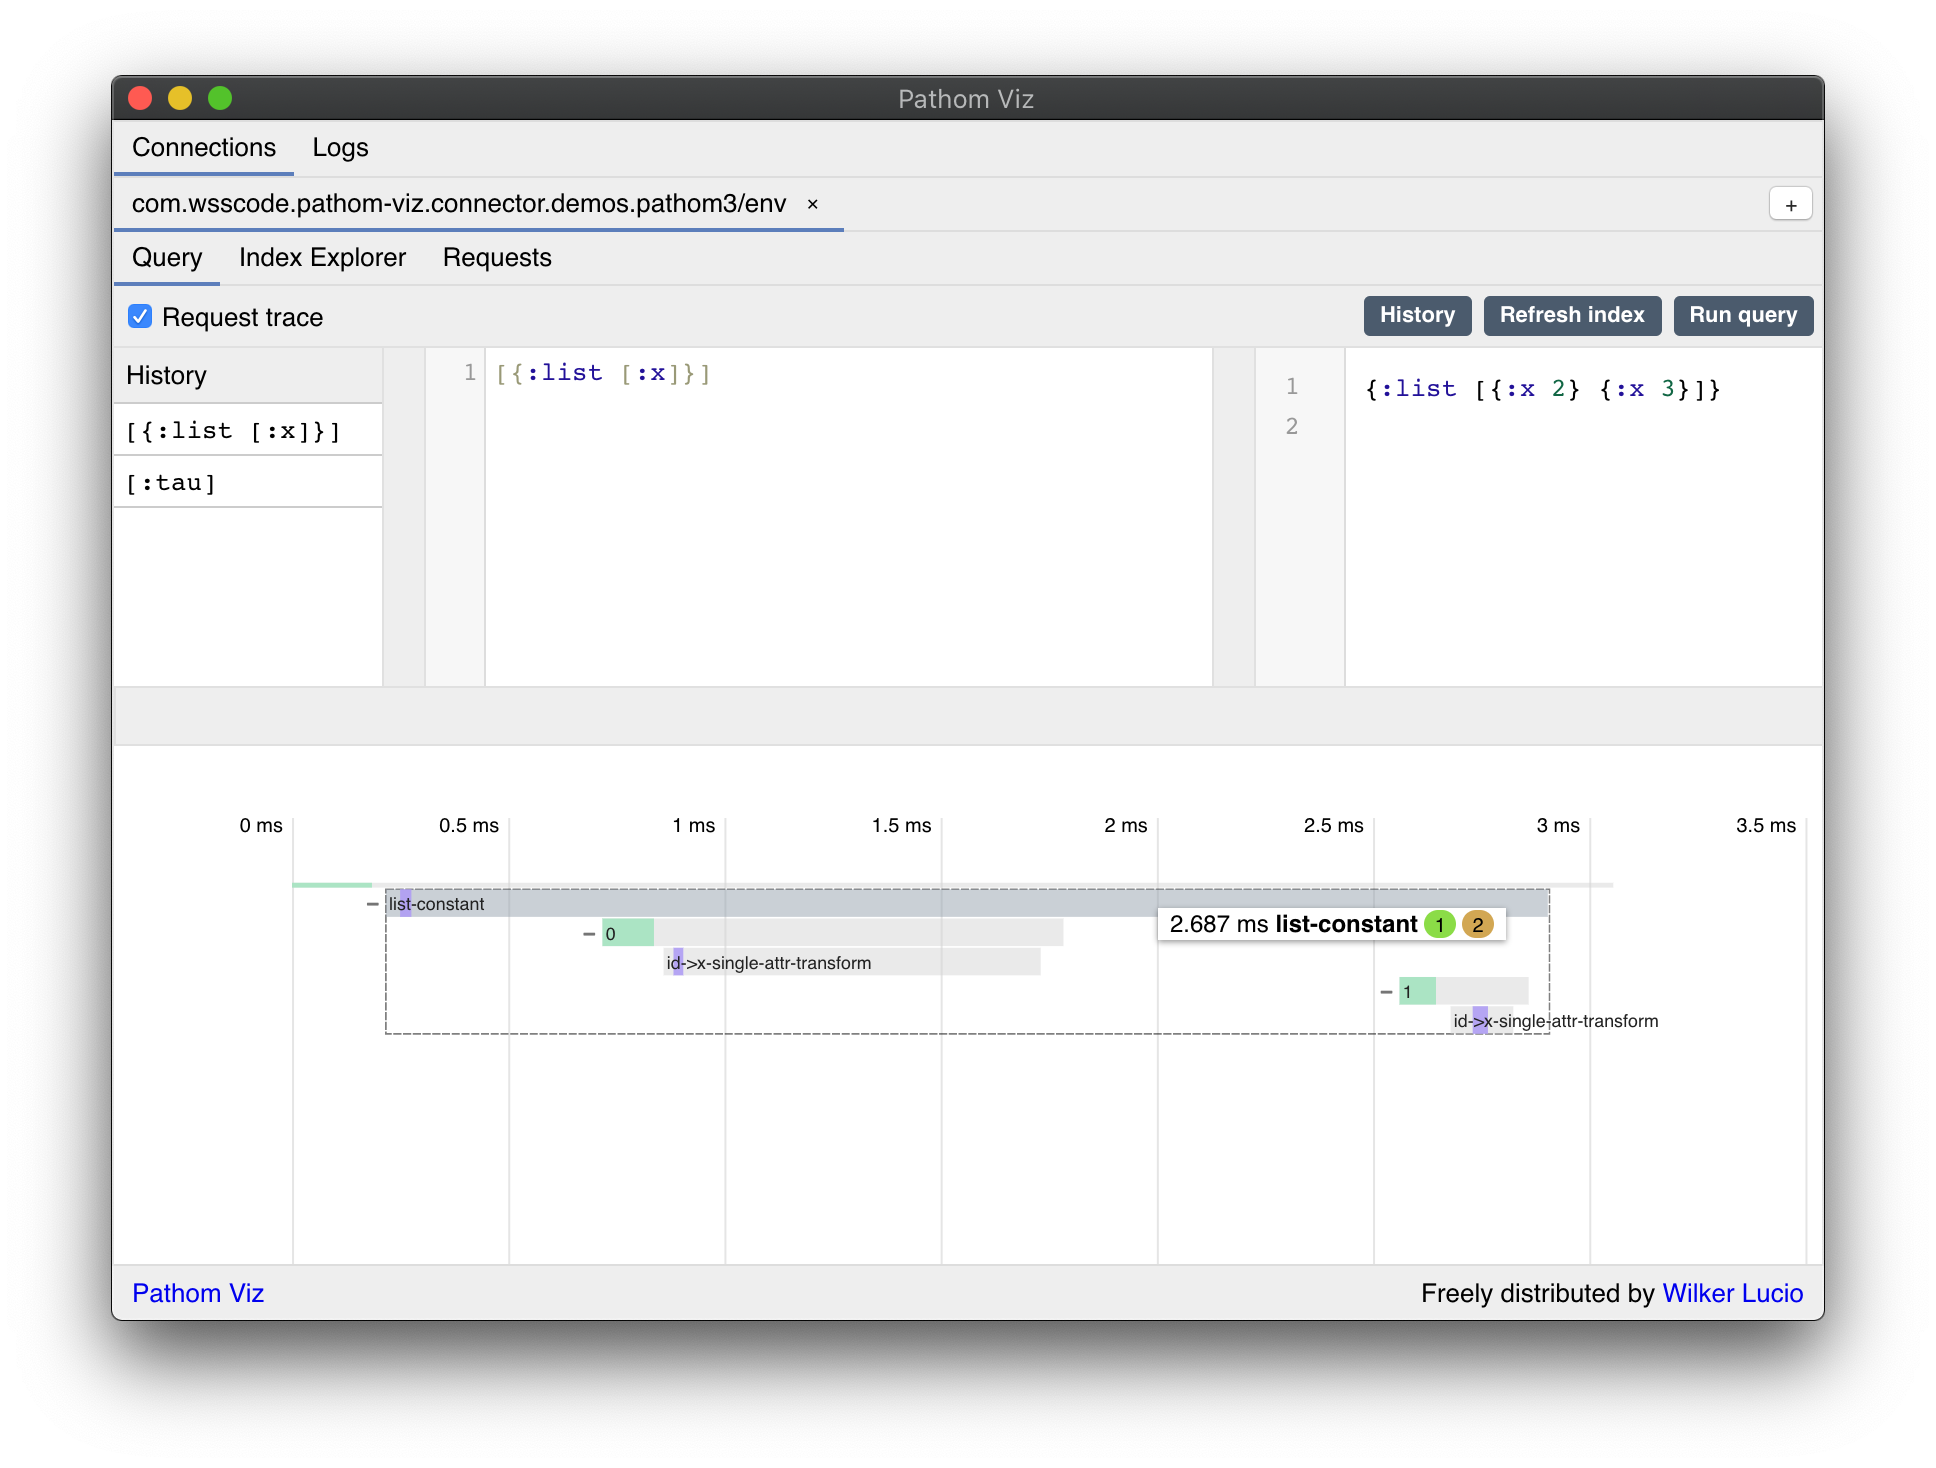
When you mouse over a block with children, Pathom Viz creates a box around that to make it easier to see the boundaries of it.
View the graph
By clicking on a block you can see the node of that block, and the plan in which it was projected. This will open the Graph View, described in the next section.
Graph View
When you click on a block in the Trace View, it opens the graph view below it:
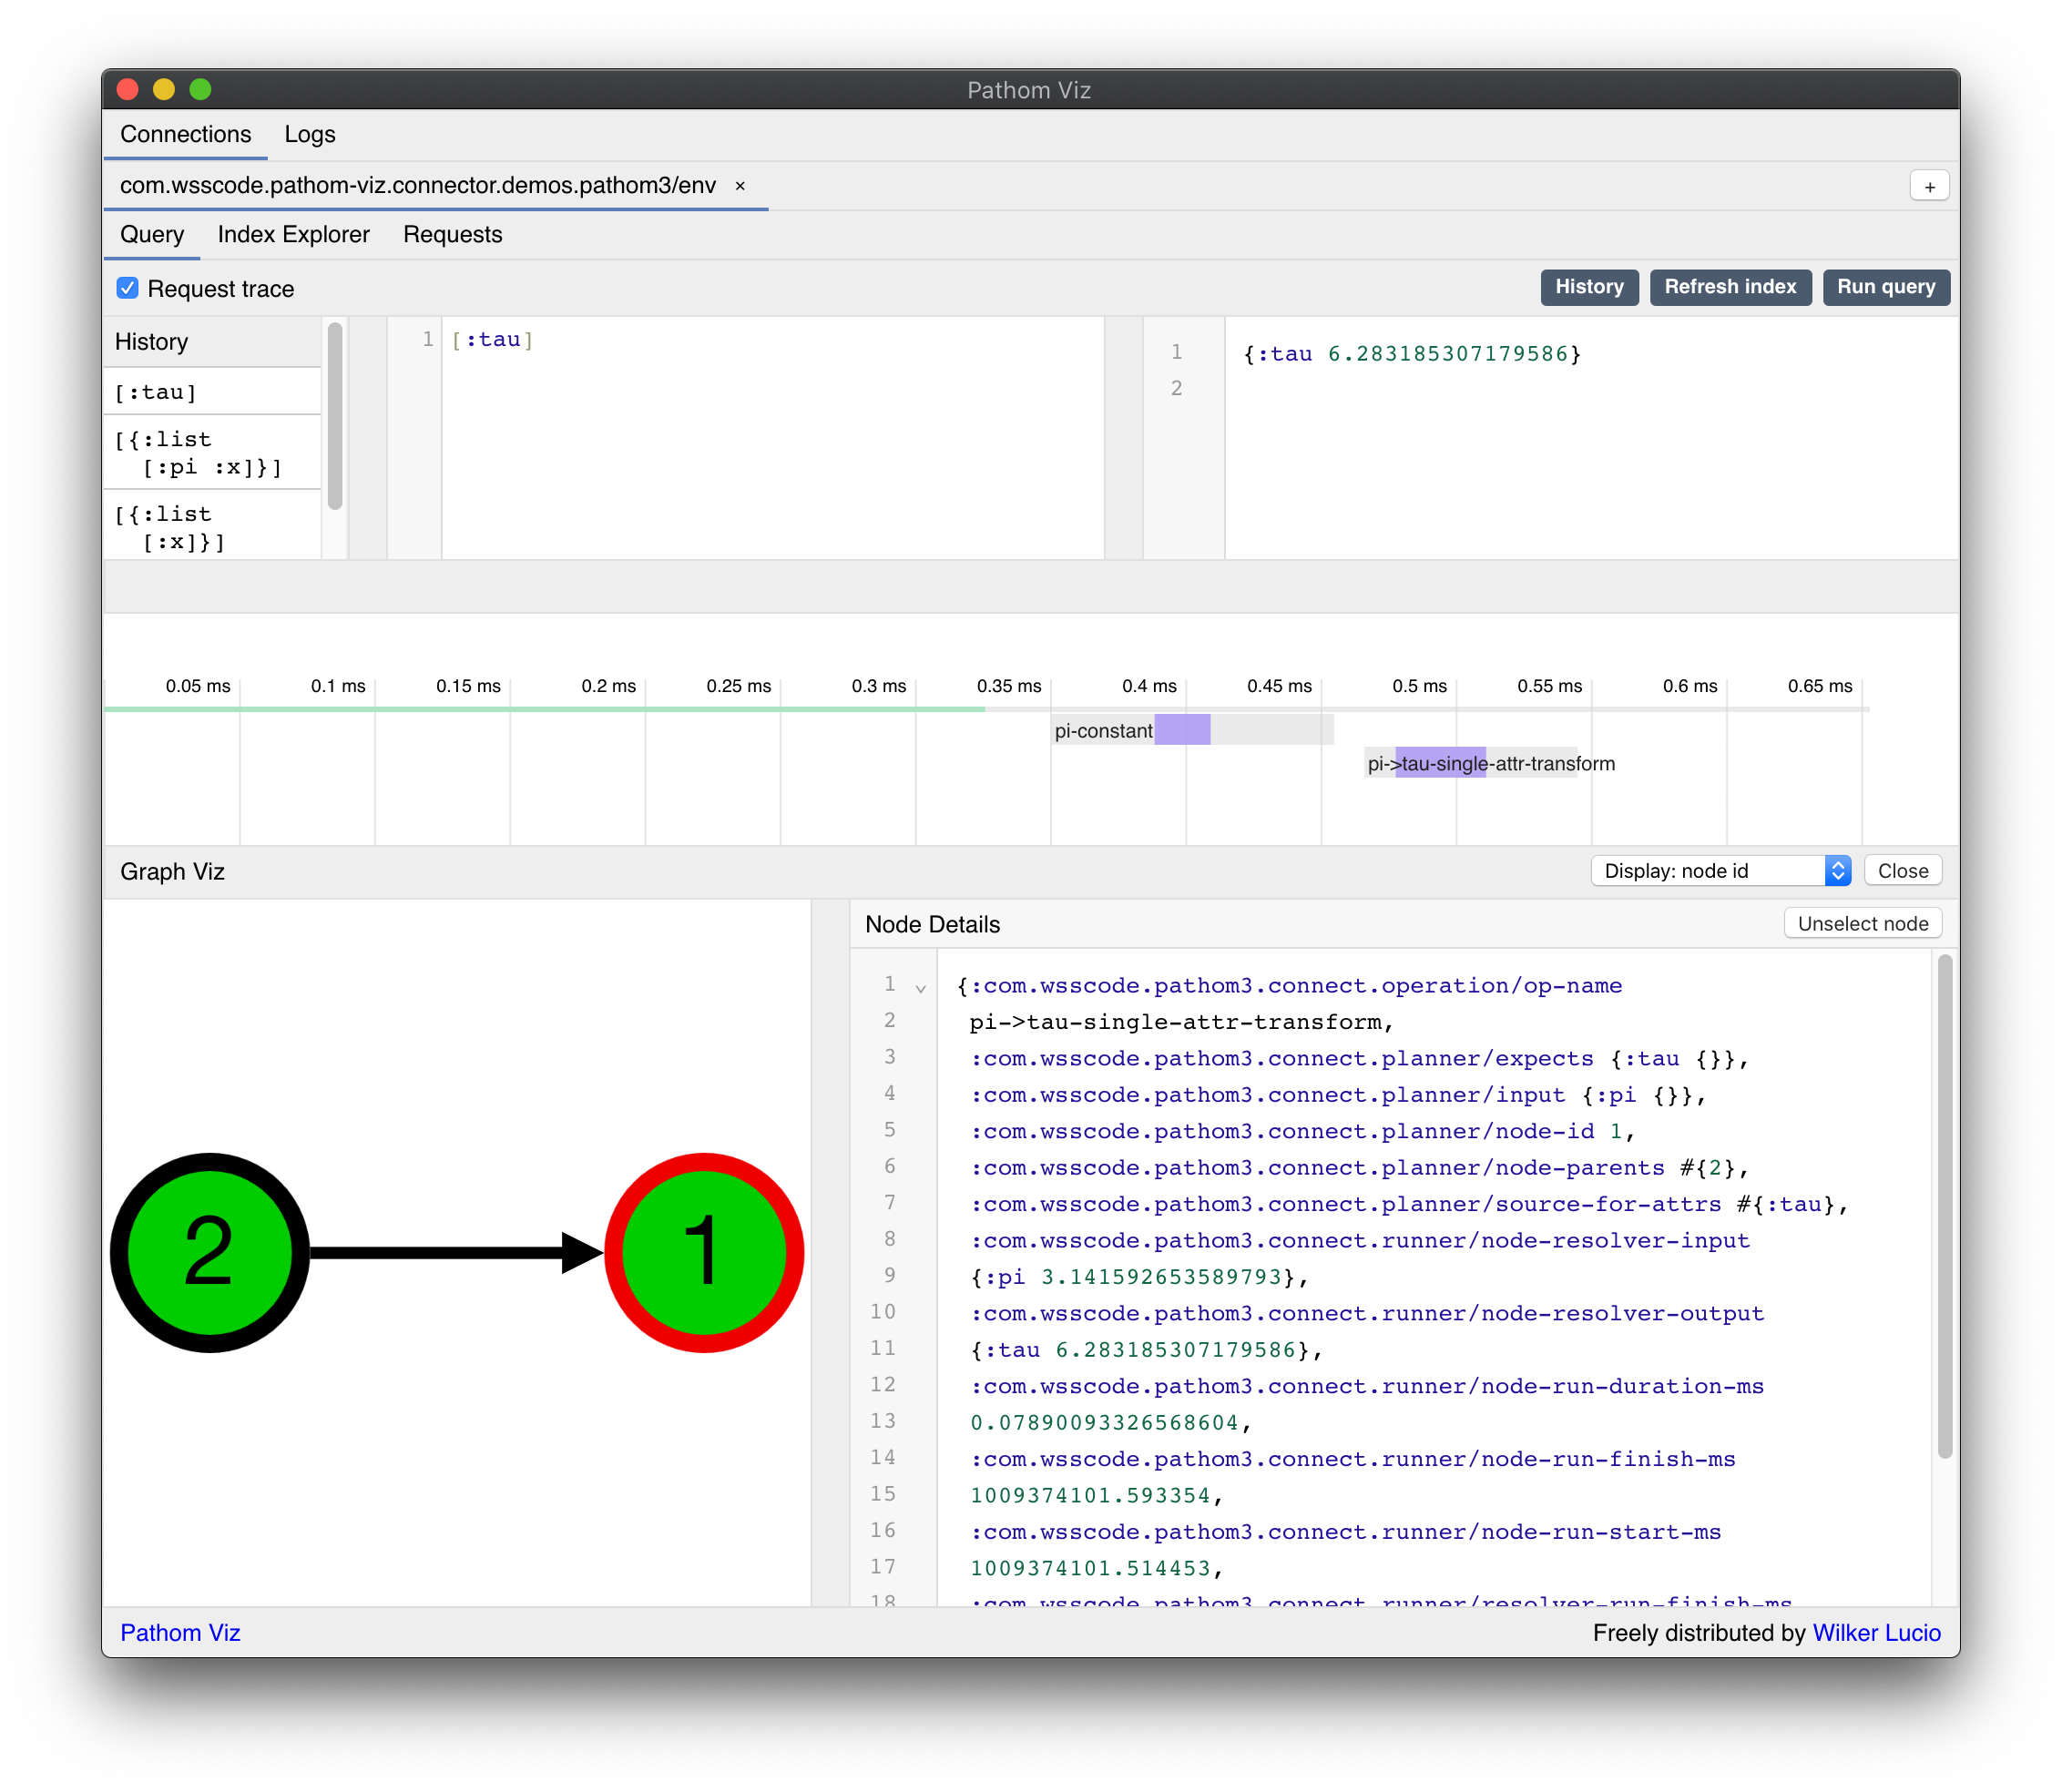
This graph represents what the planner generated for this execution.
If you clicked on a graph block, the graph opens without any node selected. In case you clicked on a node block that nodes start in focus on the graph, marked by a red border.
You will see different colors for nodes, here are their meaning:
- Green: a node executed with success
- Gray: a node that didn't run
- Yellow: a node that ran but got an empty response
- Red: a node that failed to run
- Purple:
ANDnode - Blue:
ORnode
A node with a black border means it's the root of the graph.
There are also different kinds of edges between the nodes:
- Orange edges: these happen on
ANDandORnodes, which means the branches of this composing node - Black edge: means the node to run after the current node. In the cases of branch nodes, the branches run first, and then the next runs.
When a node is selected, its details show up on the right side of the graph. The details section contains the map with all node information available.
The following graph is a more complex example that has almost all of the node types and edges (there are no failed nodes in this example):
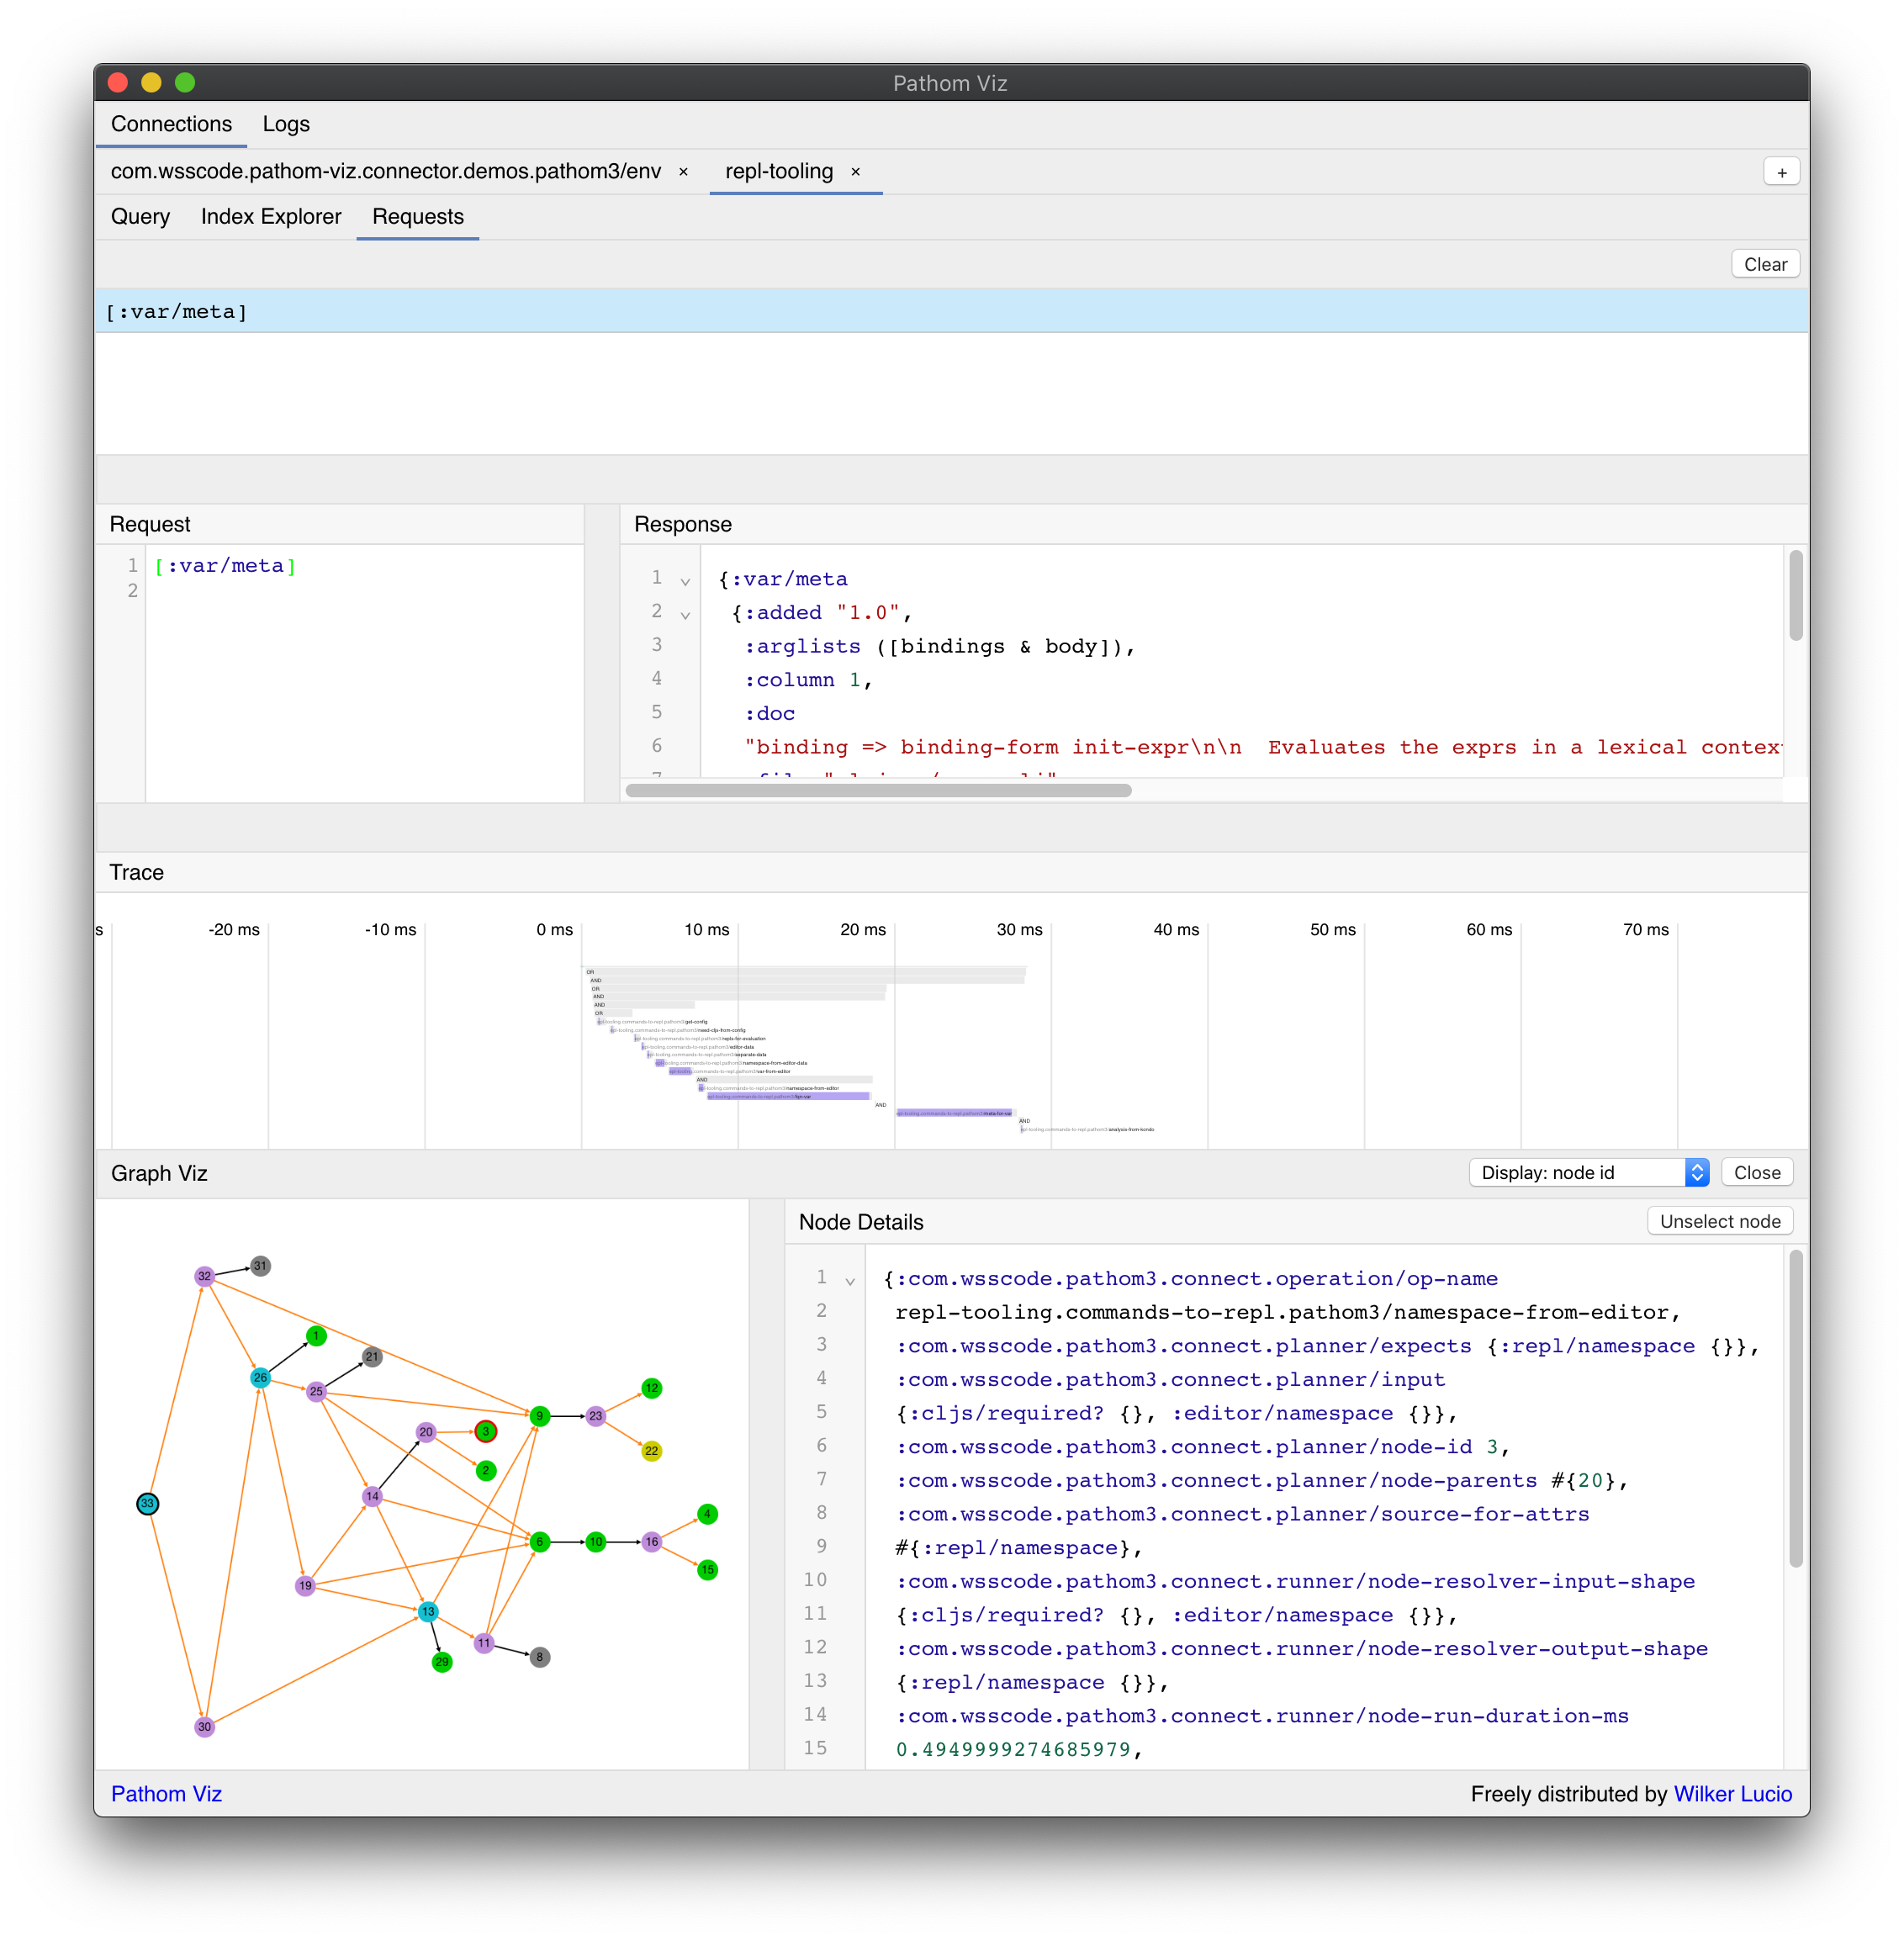
You can click on a node in the graph to select it.
When you select a node, the visualization will fit that node, and the nodes connected to it in the viewport.
Index Explorer
In this panel, you can explore the attributes, resolvers, and mutations of your graph.
To learn about this, please check the previous index explorer docs. The behavior of them in Pathom 3 is the same as in Pathom 2. This view may evolve in the future to support more of the features from Pathom 3.
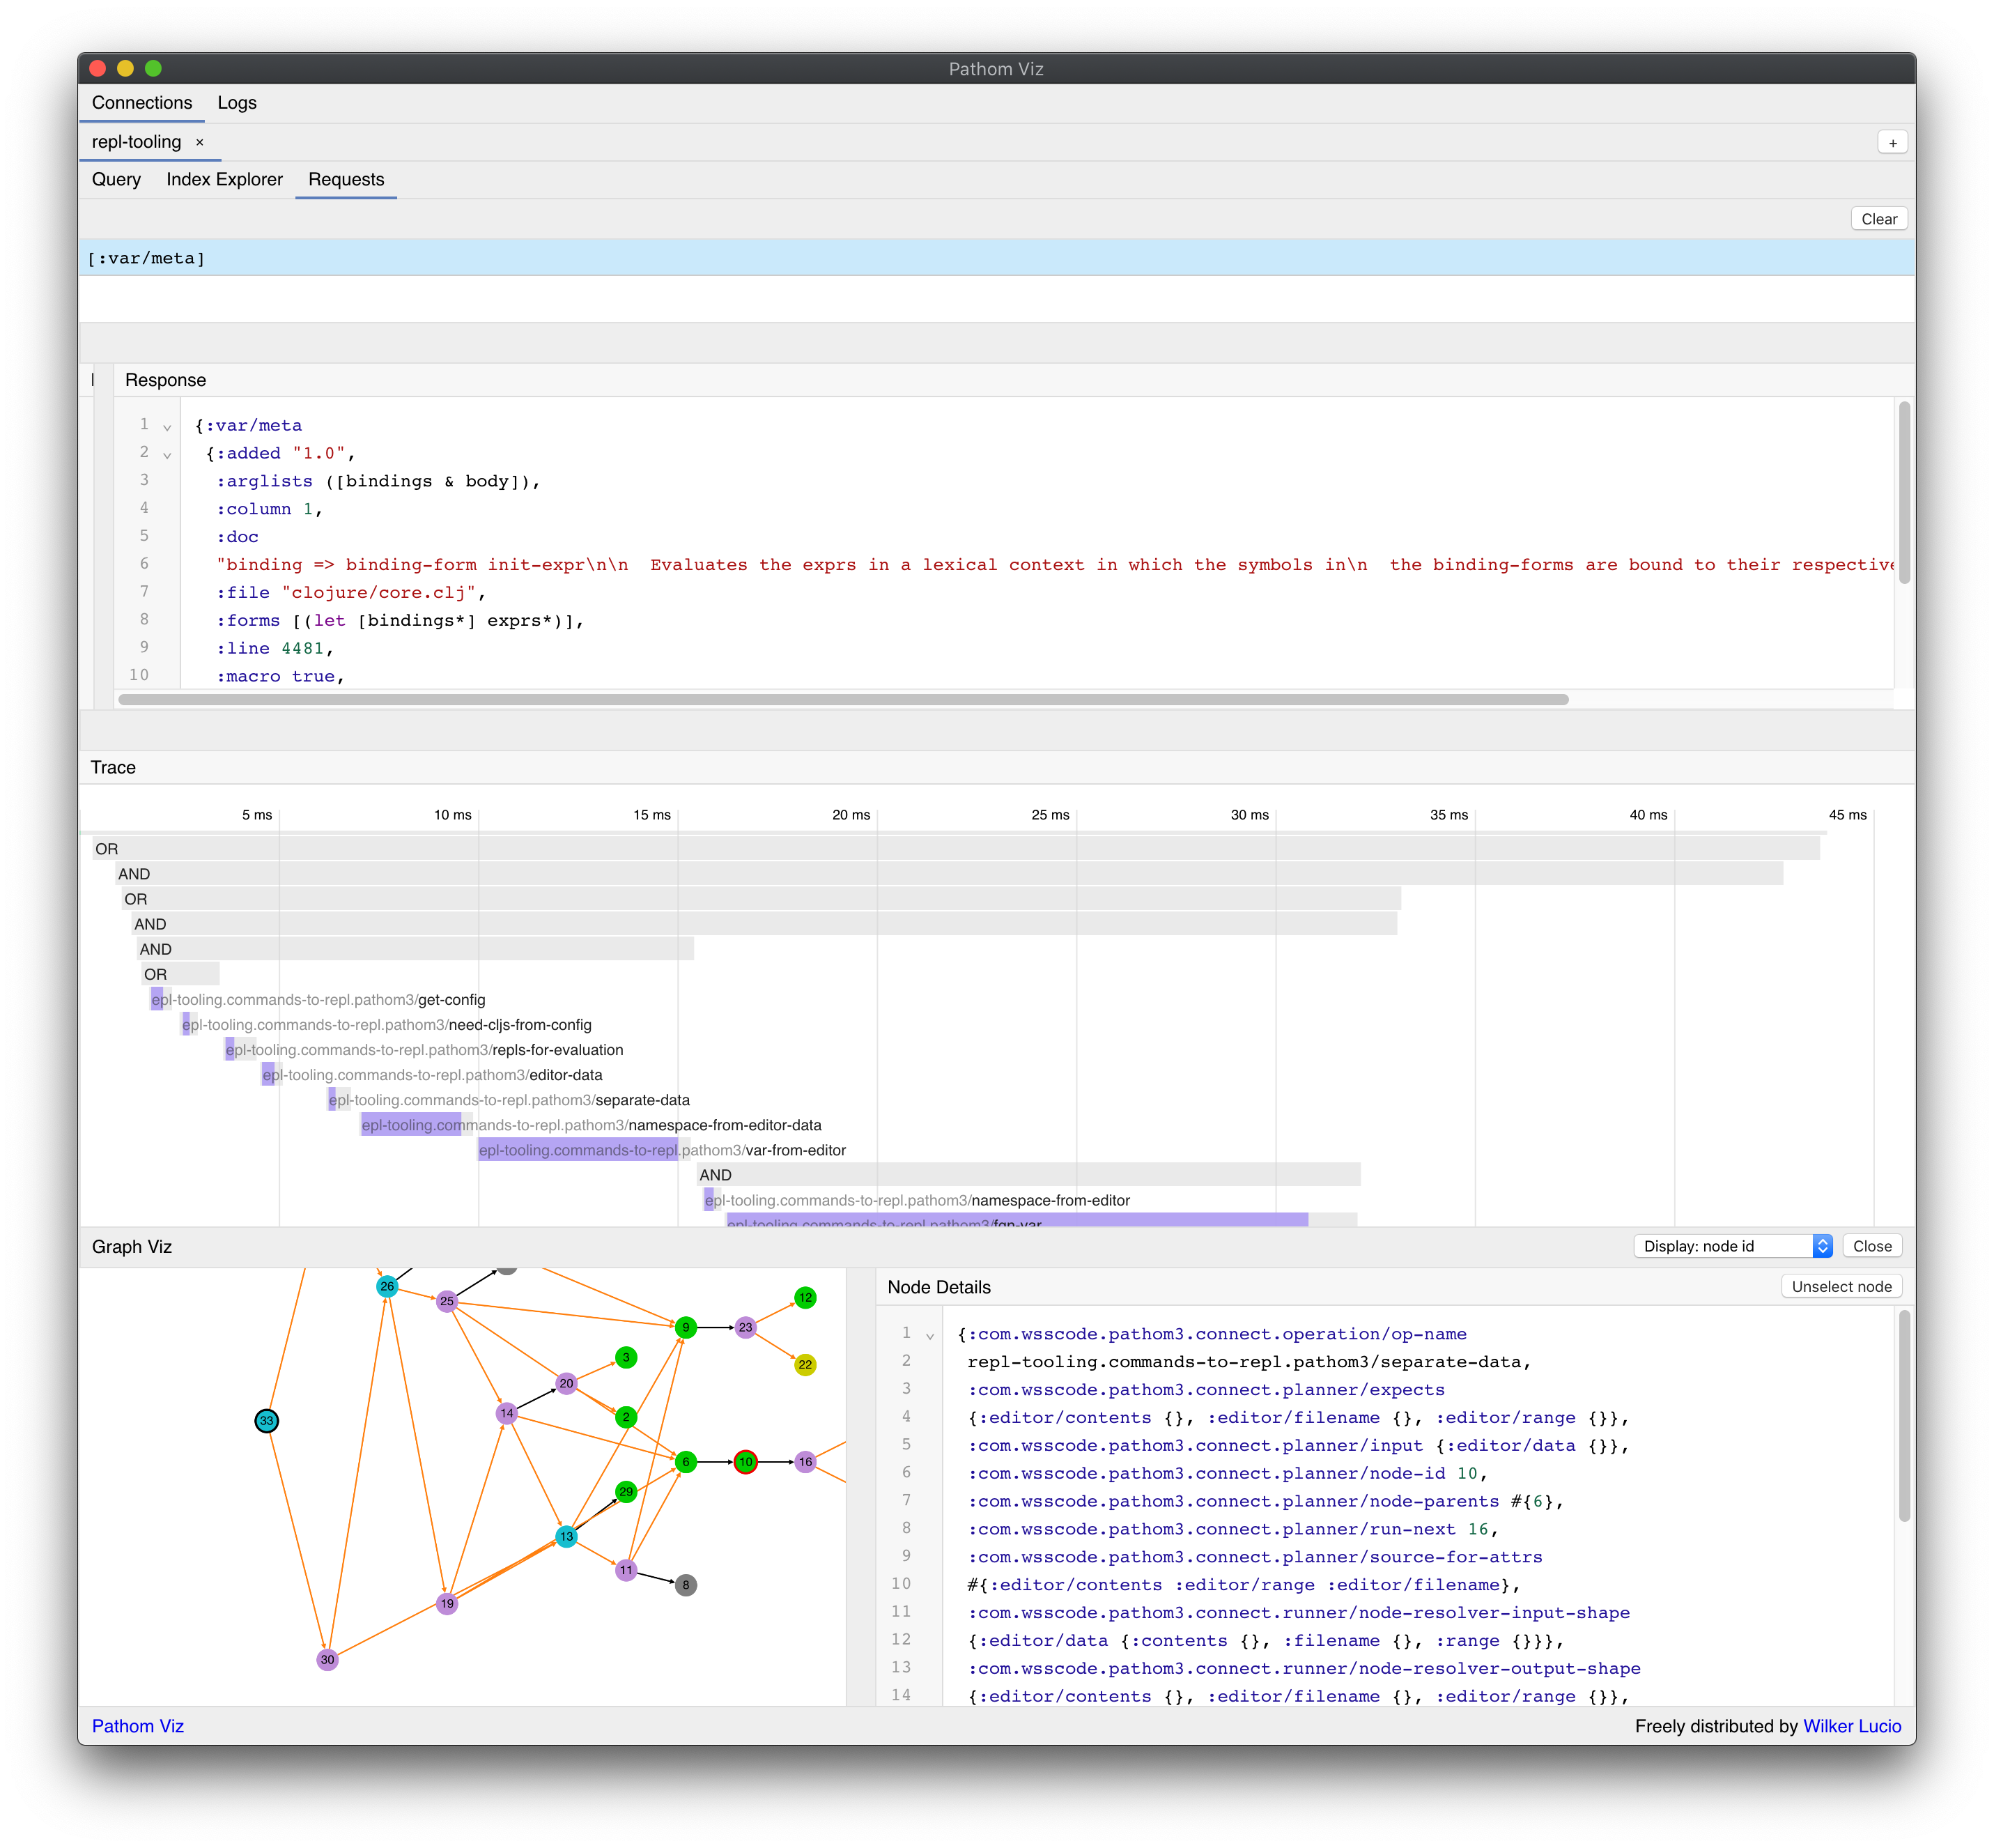
Requests
The requests tab is where you can see a log of the requests made to your environment.
This view is very much like the Query Editor, without the editing part.
You can see trace and graph view in the same way as in the Query Editor.